Hello friends, below are the list of stocks which can be traded in coming week after some patterns are formed.
- LTTS L&T Technology Services Ltd
- Infosys
- Asahi India Glass
- AB Capital
- ATUL Ltd.
- South Indian Bank (SIB)
- Oberio Reality.
So, lets begin.
L&T Technology Services Ltd.:
- Above chart is of LTTS of Weekly Time frame
- Here, you will observe that a major resistance line near its all time high (ATH), is giving resistance to the price.
- According to Dow Theory we have 6 Higher Lows.
- Lets move to Daily Time frame for deeper analysis.
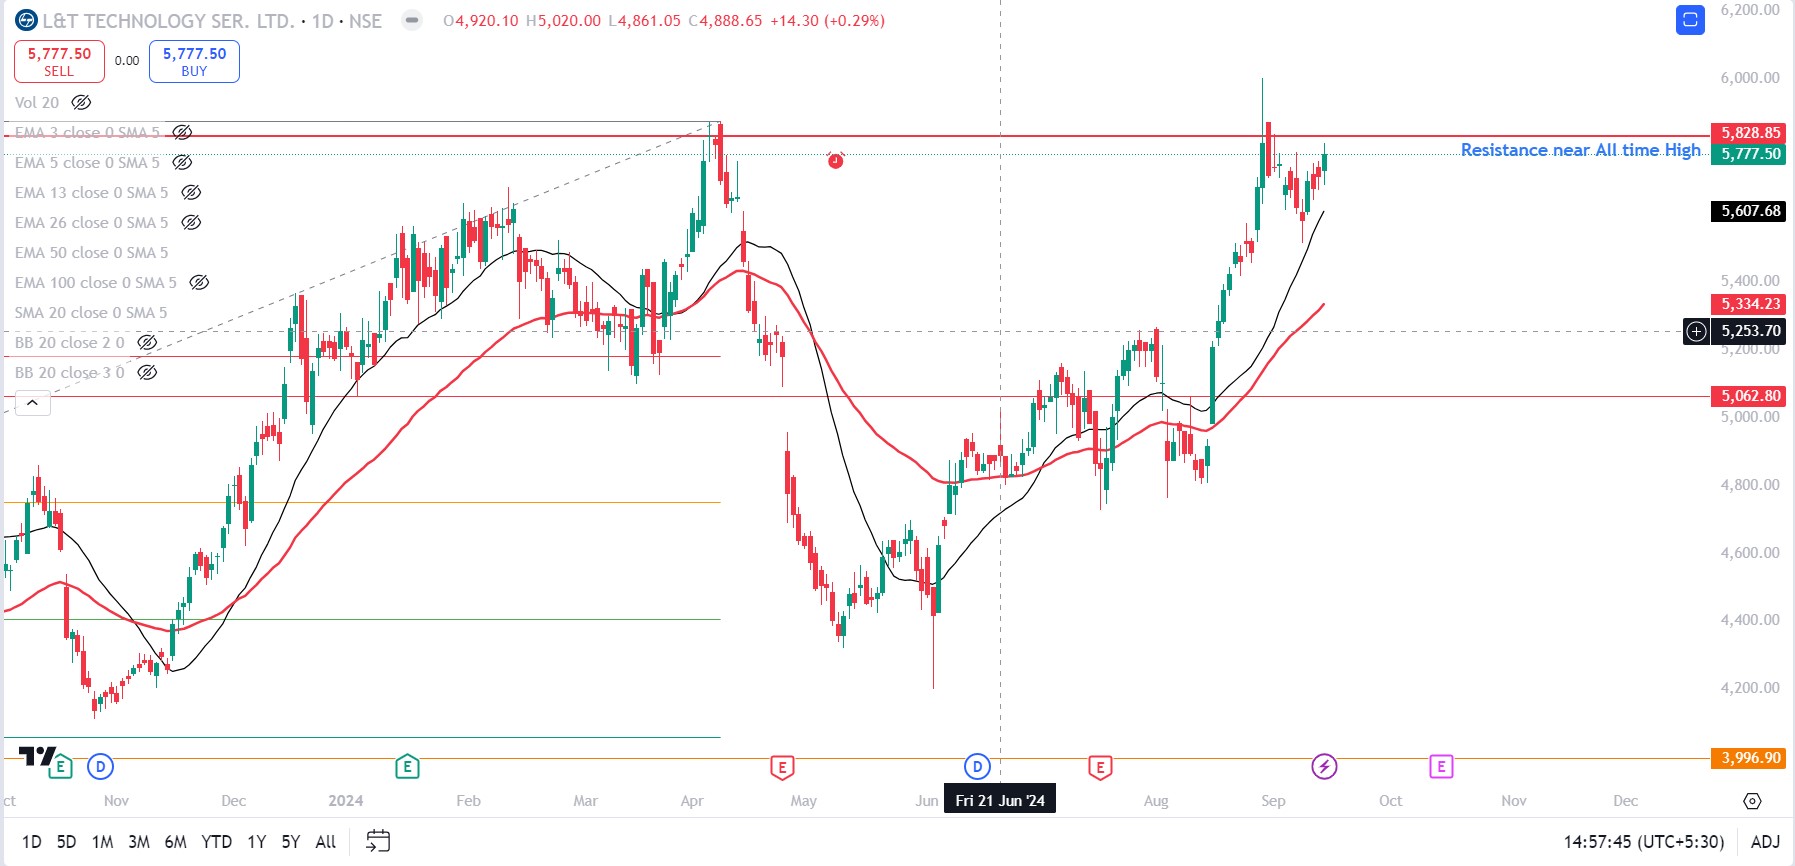
- Comparing Weekly and Daily chart you will find that LTTS already tried to break a level of 5830 almost 5 Times.
- In recent times it has also, printed a high low after fake breakout.
- So, its at a crucial point, where it might break out that level, as it has already tested many a times.
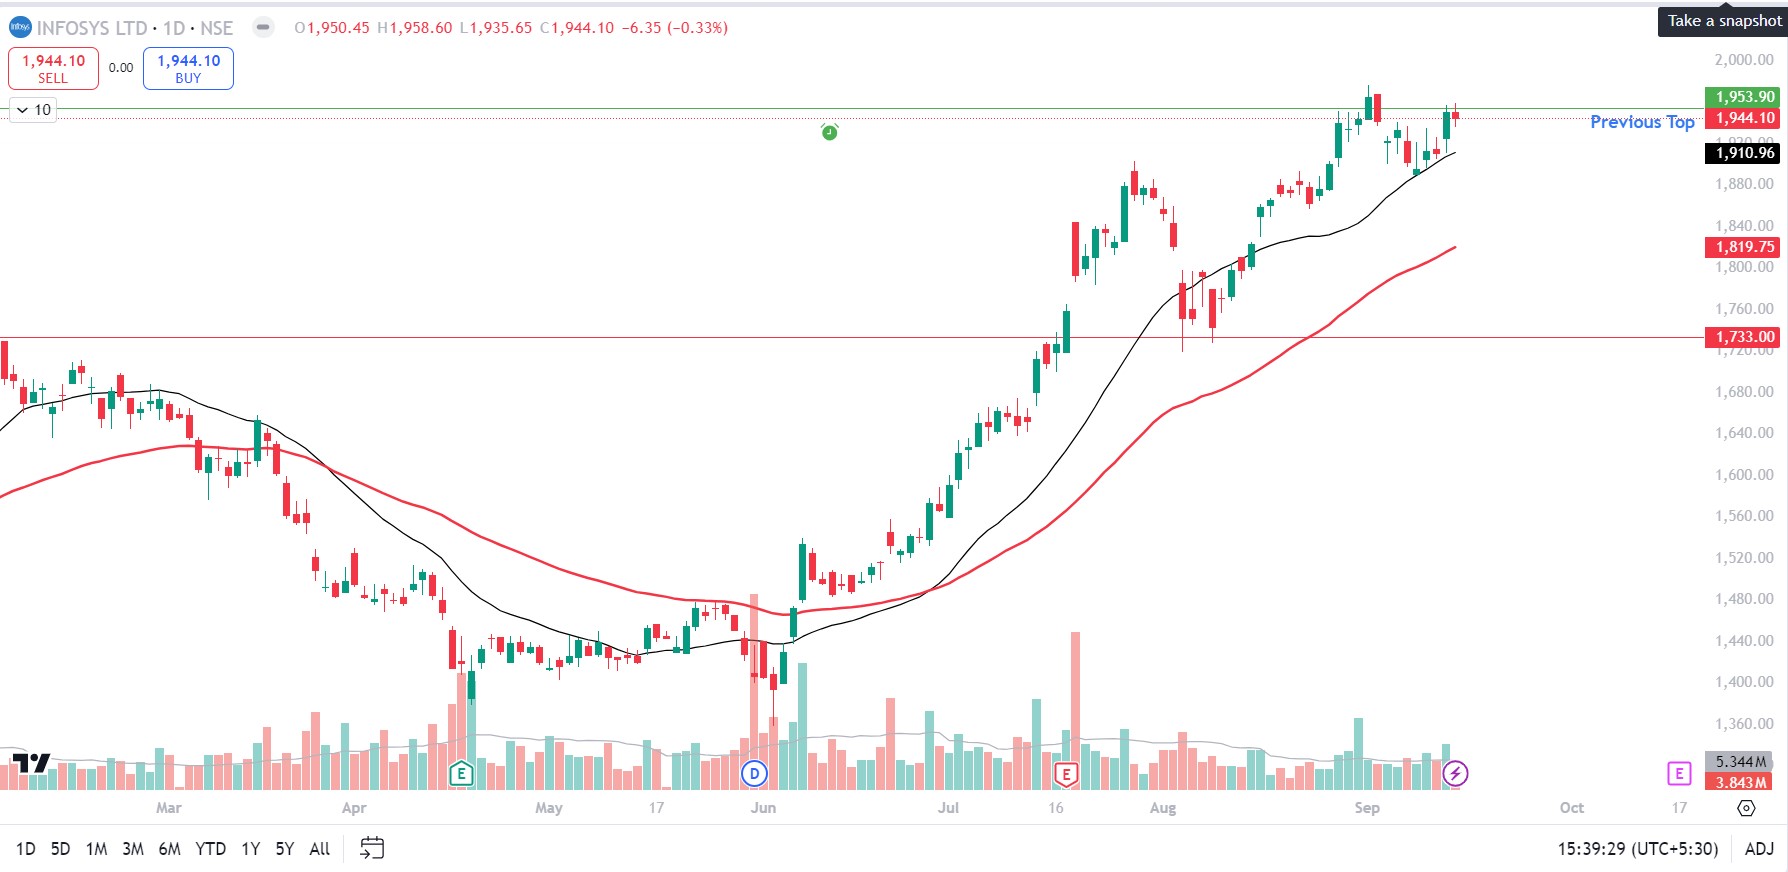
- Compaing this chart with LTTS, it has also printed same pattern wherein from its ATH it has retraced and now its trying to Break out from that range.
- Given above chart is of Daily Time Frame.
- Same like LTTS, it has tried to breach a level of 1954, but failed and after doing a Higher Low as it is retrying again.
- If it breaks the leel of 1954 successfully with a good volume then, you can see a good momentum in price.
Asahi India Glass:
Weekly Chart:
Daily Chart:
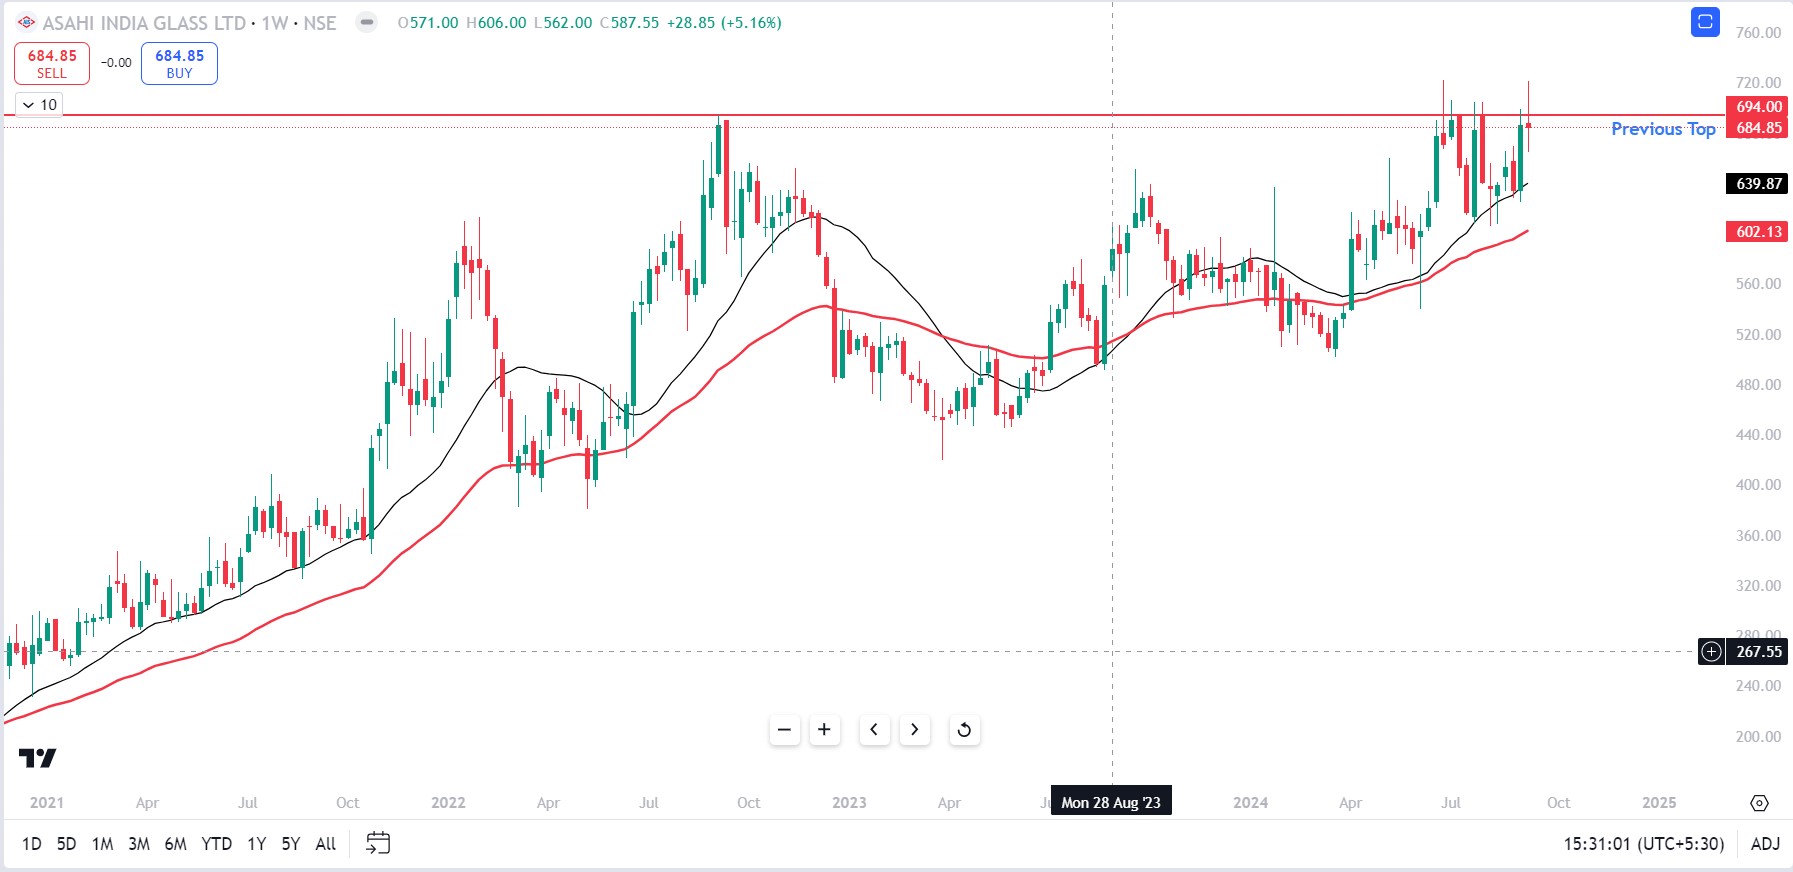
- As you can see both Weekly and Daily chart, one thing to notice is that, No proper Weekly Closing above 694 has been given by Asahi India Glass.
- So, wait for a convincing breakout above 694 with good volume and thereafter we can try to initiate trade with a good Stop Loss.
AB Capital:
- Here, you can observe a probable trendline breakout, wherein if a breakout happens then we need to take a trade but with a good SL.
- 229 is also an important level, where we can observe that a minor Inverted Head and Shoulder.
- According to my POV, we should wait for Breakout of 229.
ATUL LTD:
Weekly Chart:
Daily Chart:
- After observing weekly chart we can see that there is a major trendline breakout.
- It has also retraced approx. 62%
- Thereafter, after doing a major Breakout stock has been sideway and forming a Flag and Pole pattern.
- In Daily time frame you can observe that stock is currently in Sideways trend and to initiate a trade Break out trendline is necessary.
South Indian Bank:
Weekly Chart:
Daily Chart:
- From weekly chart we can observe a prominent Cup and Handle pattern, Cup pattern form is of 5 Years and its breakout happened in 2023.
- From there it has travelled to a price of 37 and retraced toa 38% level (Level of 24)
- From daily chart you can see a wedge pattern and Break out Trendline may happen.
- So, lets wait for a break out and then initiate a trade with a strict Stop Loss.
So Friends that’s all for Today, I will be posting next set of picks soon,
Till Then Stay tuned!!!!!!
If you have directly landed on this page do check out my other informative sections of blog below:
- Basics of Stock Market
- Stock Picks of the Week
- Watchlist of the Week
- Stocks
- Indices
- Currencies
- Commodities
Note:
Stop Loss should be on closing basis. For Example after Buying Whirlpool for 2140 and at end of the Day/Week/Month based on Chart Time Frame, if it is Closes Below 2091 then you can confirm that our Stop Loss has been triggered.
PLEASE FOLLOW STOP LOSS STRICTLY TO PRESERVE YOUR CAPITAL
Please read Disclaimer before Investing.
If you have liked my article then do Share, Subscribe & Follow my Blog and do leave a Comment.
Have a Great Time ahead!!


