
Hello friends hope you are feeling well,
Today I am going to discuss about technical charts, a Bit Introduction of Technical charts and describing What is a Technical Chart?
So let’s begin,
What is a technical chart?
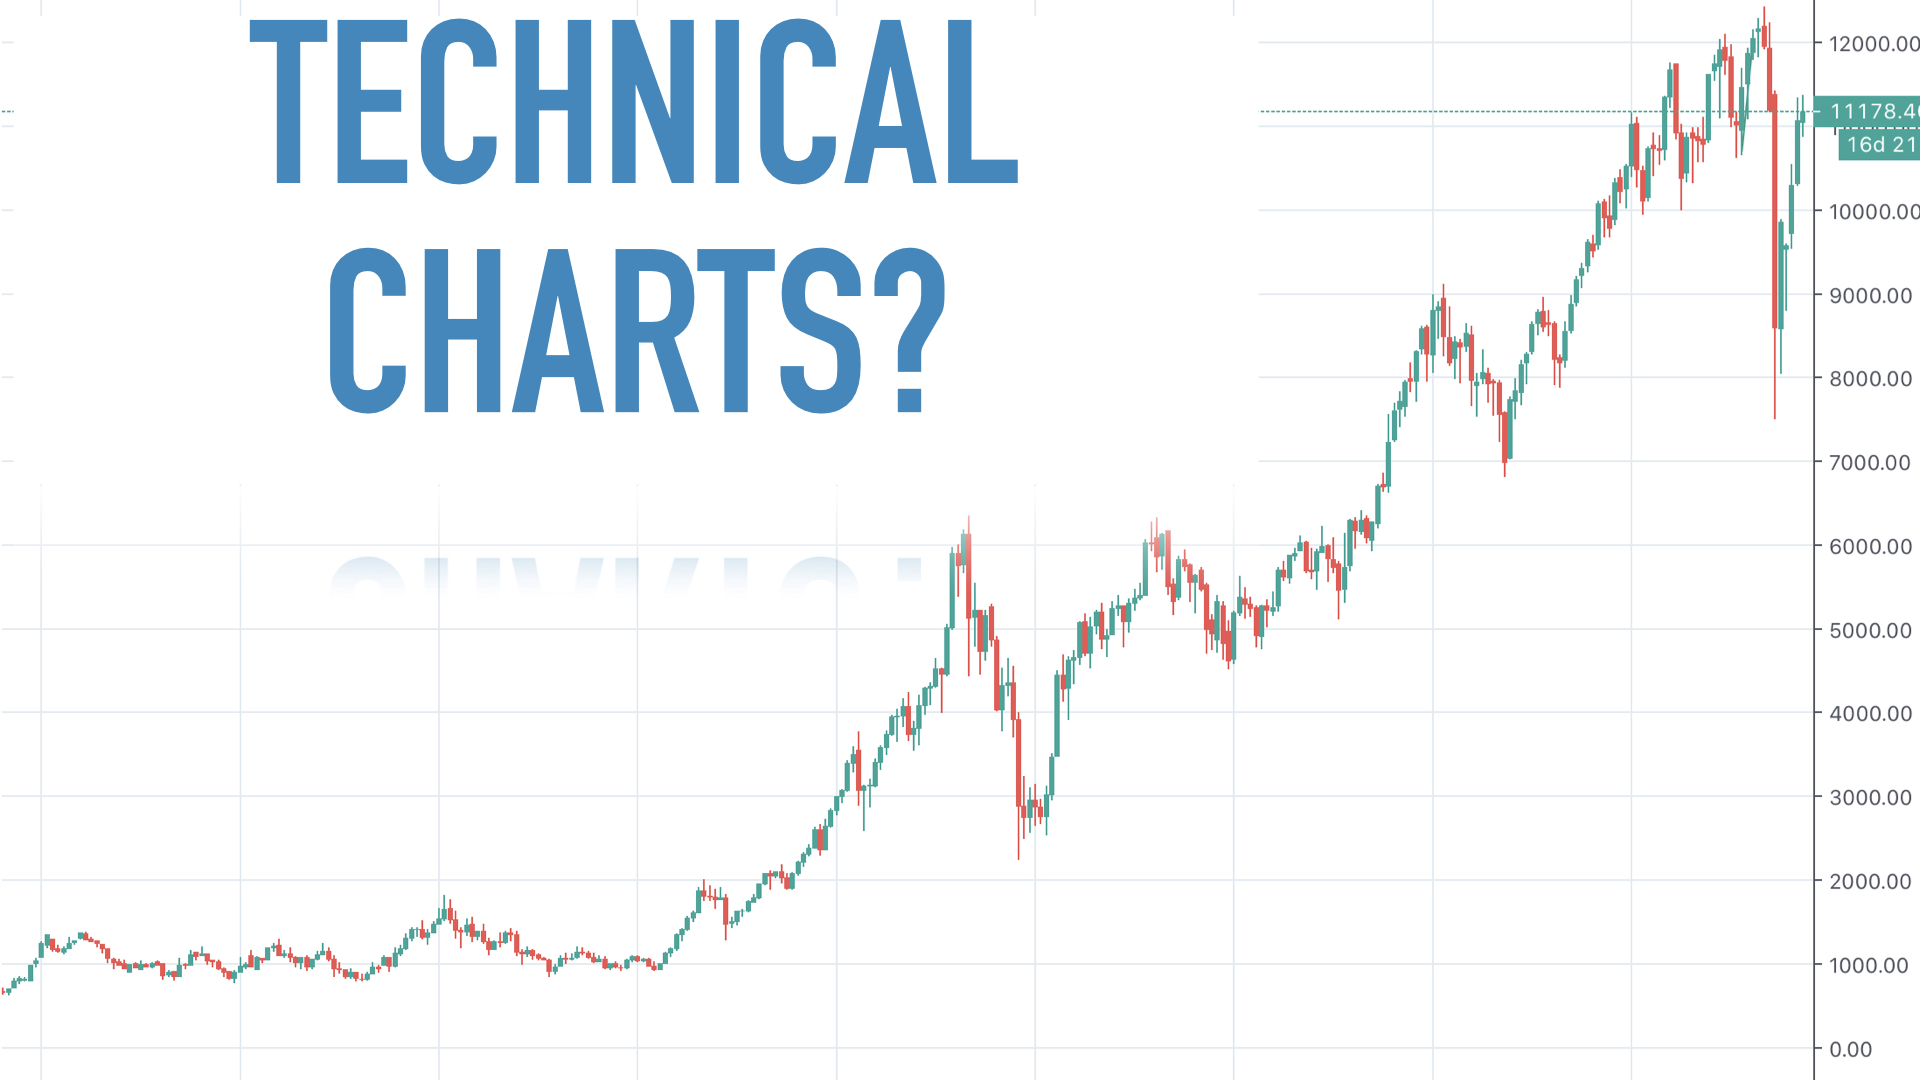
Technical Chart is a tool where prices are plotted with respect to time, where prices are on the Y-axis and timeline is on the X-axis.
Here is a Glimpse of How the Chart Looks.

Now the Question Arises,
Why to use a technical chart?
Technical Chart is an important aspect or you can say BACKBONE of a technical analysis where technical analysts do their Technical Study and forecast the future price action of a particular stock, index, currency or a commodity.
As in the stock market it is very difficult for a technical analyst to keep track of a particular script of their price change on a day to day basis. Hence this technical chart is a boon for them to keep track of prices and their movements of prices at a particular Time, Day, Week or a Month.
Technical Analyst itself a Trader, Investor or Portfolio Manager, so the Analyst chooses his own time frame on Technical Chart which may range from Yearly to a Single Minute.
So basically all in all Technical Charts help Technical Analysts to make his/her own Investing Decisions.
Now Next Question in your Mind would be,
Where to Find Technical Chart?
There are many sites which provide Technical Charts and their tools for study, for example Trading View, Investing are one of the most relied sites but they too have their advantages and disadvantages.
Trading View
Trading View provides the best and accurate platform but it charges according to their plans and have limited access to their technical tools.
For viewing Chart on Trading view you may follow below Steps:
Click here to redirect on Trading View >> Click on Start Now under Basic section for free usage or you may select your plan as per your convenience (Initially for fresher I would personally recommend to Start with Basic Plan to get use to with charts) >> Click on Sign Up and You may create your account as per your convenience >> When Account is created >> Click on Chart Tab on Top bar >> Then Chart will open and you are Ready to do your Analysis.
Here is the Screenshot of Trading View Chart:

This was for Trading View Chart, now let’s check other options too
Investing
Investing is a good platform, but not as accurate as Trading View, we can say it is 95% Accurate as Trading View and Yes main Advantage is its Free and majority indicators which are enough for your trading decisions are available here.
Steps for Viewing Chart on Investing:
Click here to redirect to Investing site >> Click on Free Sign up on Top >> Create Your account >> After Account is Created >> Basically there are two easy where you can access charts:
First way is to directly click on charts >> Live Charts >> Click on Full Screen Tab.
Second way is to Click on Portfolio >> Create Your Watch List >> Click on Charts besides Summary Tab, which will show charts of your Watchlist and you would be able to navigate your Watchlist Stocks/Scripts easily.
Here is the Screenshot of Investing Chart:

Brokers Trading Platform Charts:
You can easily opt for Charts of Broker from which you do Transactions in the Security Market. One of the Best brokers which provide good charting tools is Fyers and Zerodha. These both broker provide Trading View Chart with Limited access you can say (90%) is available.
Now your question would be which broker to Choose,
If you want to choose from the above two brokers specifically for Studying on Technical Chart? Then my suggestion would be to go with Fyers, they provide Charts which are from Trading View site as said earlier and are 99% Accurate & Stable and you will surely enjoy your Study on those charts because they are more user friendly.
If you want only for charting purposes then open Trading Account and not Trading Account including Demat Account. Mostly Demat Account have Yearly Maintenance charge and Trading Account does not have any Maintenance Charges.
Steps to View chart on Fyers is as below:
Click here for Fyers official Site >> Drag your Cursor on Sign In Tab >> Click on Fyers Web >> Chart would be opened.
Here is a Screenshot of Fyers charts:

To open an Account in any of above brokers find the referral link below:
- Fyers: Click her to Open an Account
- Zerodha: Click here to Open an Account. (Account Opening Steps for Zerodha)
If you don’t want to open an account through referral links, then you may directly go to their official site.
Final Conclusion:
Trading View is an absolute no Brainer, with all International Market Chart available, its best, but Charges for its Facility.
Investing is Good and Free with International Charts available, but with less accuracy (My Experience)
Brokers Platform speaking with respect to Fyers is best for Indian Stock Market Scripts.
All in all if you are planning to Trade in Indian Stock Market, then go with FYERS, Otherwise if you are planning for Commodities and Currencies, then for initial Phase you can go with Investing and if you are trying to Trade in both Currency & Commodity and as well as Indian Stock Market you can opt for Both Investing and Fyers.
Ultimately after having a good grip and generating enough income you may switch to Trading View which ticks our all boxes with superb accuracy.
Now the next question in your mind would be,
How to use a Technical chart?
Use of Technical Chart is a very vast subject which can be covered in parts. Some of the Subjects are as below:
- Type of charts
- Dow Theory
- Candlestick Patterns
- Time Frame Analysis
- Chart Patterns
- Price Action
- Indicators
All these subjects would be covered in separate articles where we can study those in depth and gain knowledge about how to use them in a practical way.
Well this is all for today, hope you may have liked the article, then Do Share with your friends and don’t forget to comment.
If you have directly landed on this page do check out my other informative sections of blog below:
- Basics of Stock Market
- Stock Picks of the Week
- Watchlist of the Week
- Stocks
- Indices
- Currencies
- Commodities
Thank You!!
Take Care!!
See you soon with a new article.
Image Credits: Tradingveiw.com, Investing.com and Fyers.in