
Hello friends, I hope you are all doing great!!
Today we are going to analyze LIC housing Finance, after looking at the chart I thought, I should do some analysis on it because it is at an important level which could be important for you as well in trading or investing perspective.
So let’s begin!
Introduction:
LIC Housing Finance Limited (LIC HFL) is one of the largest Housing Finance Mortgage loan companies in India having its Registered and Corporate office at Mumbai.
LIFE INSURANCE CORPORATION OF INDIA holds founder, promoter & controller status.
LIC HFL is an associate/subsidiary company of LIC of India.
In 1994 LIC housing finance was listed on the stock exchange through public issue on 15 November 1994 but currently we have data from May 1997.
Chart Analysis:
Some Notations:
High: 794 (June 2017)
Low: 4.70 (May 2000)
Analysis:
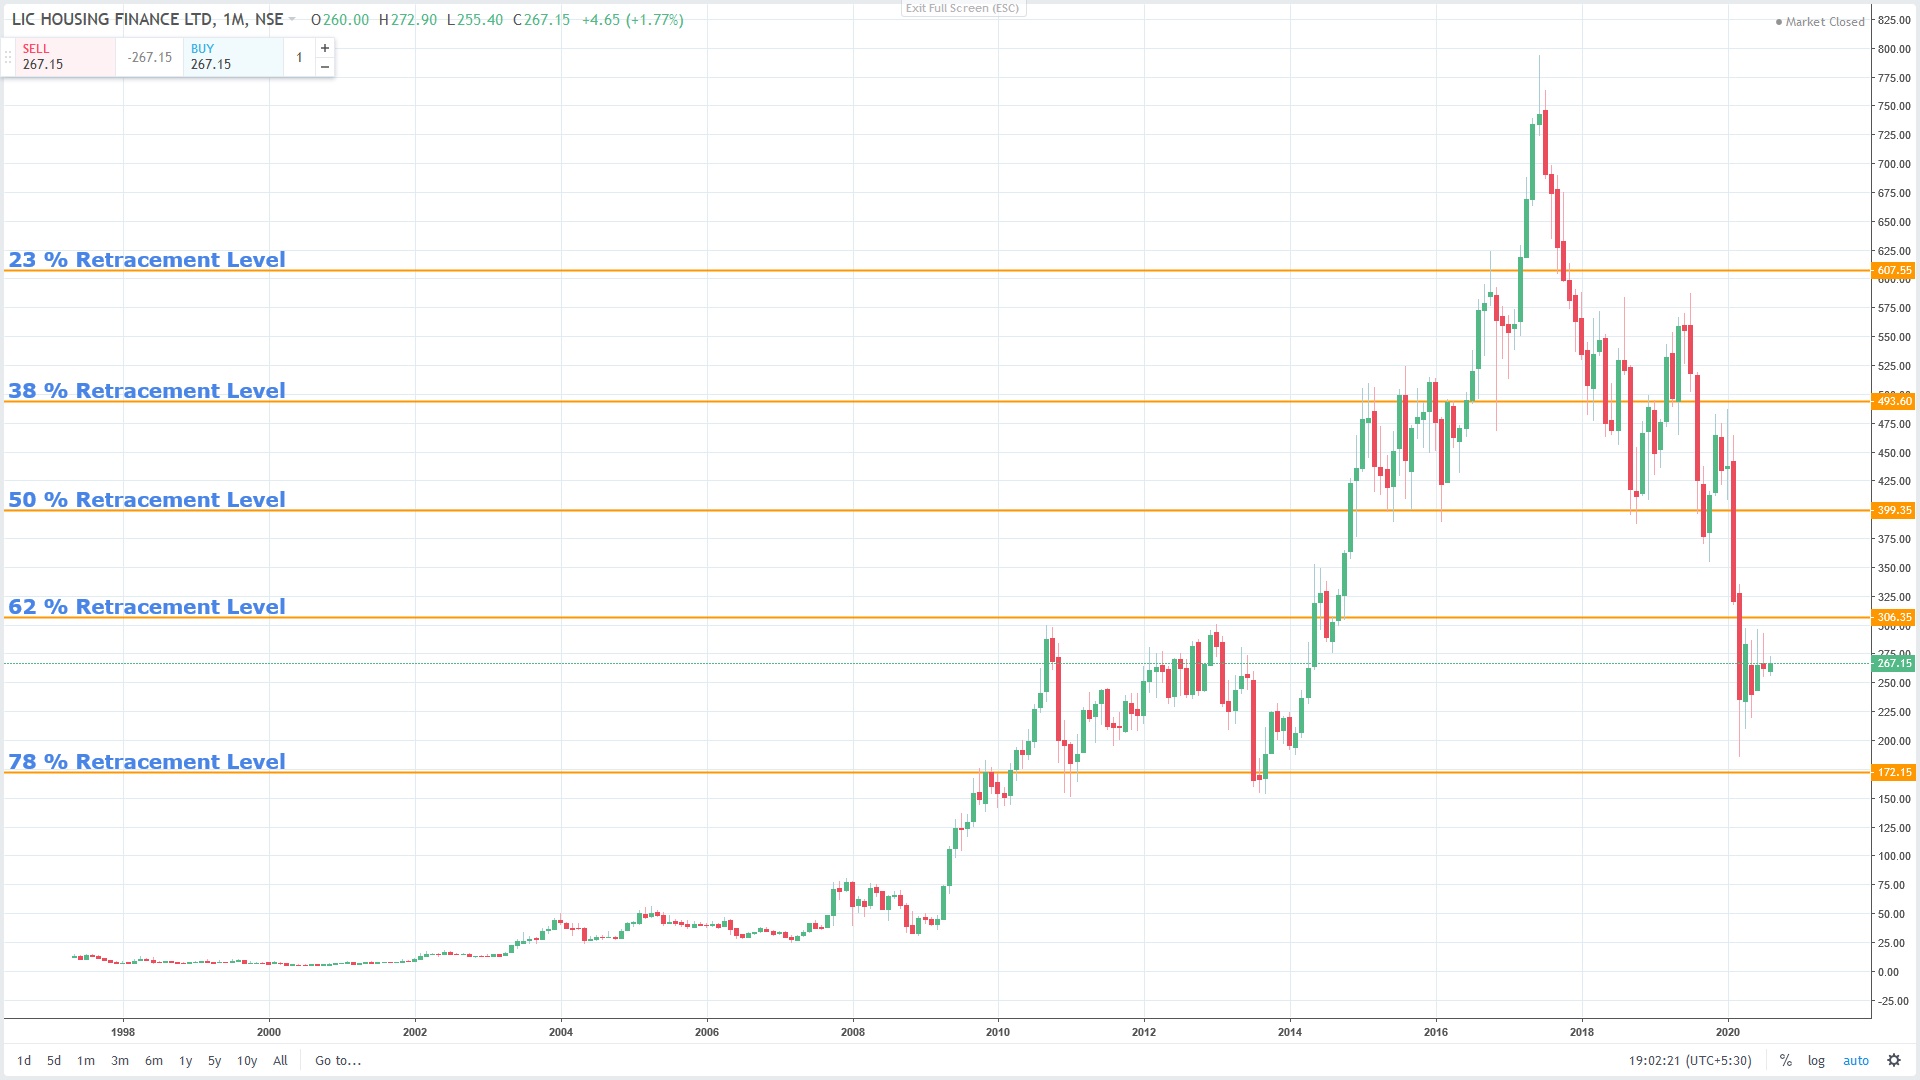
For more Concrete analysis let’s move onto a monthly chart which is posted above, from the chart we can see that LIC housing finance was at its all time low in May 2000 after that it has never went to that price and then from it is making Higher Highs and Higher lows, higher highs and higher lows.
In between it had few corrections one of which is a major market crisis in 2008 and afterwards in 2010 it also corrected with huge price fall and then afterwards in July 2013 at started its upwards journey, but in March 2015 it was in a sideways period that is from March 2015 to May 2016 which is more than a year and after that it broke a Major Resistance Level of 515 and then it started its upward journey again till it reached its all time high of 794 in July 2017
After attaining all time high of 794 in the month of June 2017, In Same month it self it Printed an Inverted Hammer which is a very Bearish Sign, In Next month itself, low of that hammer was broken and which made its way for a Big correction, Still that Correction is Going through until a Low of 185 which was made in March 2020
After making a low off of 185.25 in March 2020 due to covid-19 reasons the prices has sustained above 240 in monthly closing and now we can see that its prices are been in sideways for more about 2-3 months after march, For More Clear view we have to analyze a lower time frame chart which is a weekly time frame Chart, so let’s move on to a weekly time.
All in all we can currently say that LIC housing finance is corrected between 62 and 78 % of its whole uptrend, so now let’s analyze the price, how the price action is panning out in lower Time frame
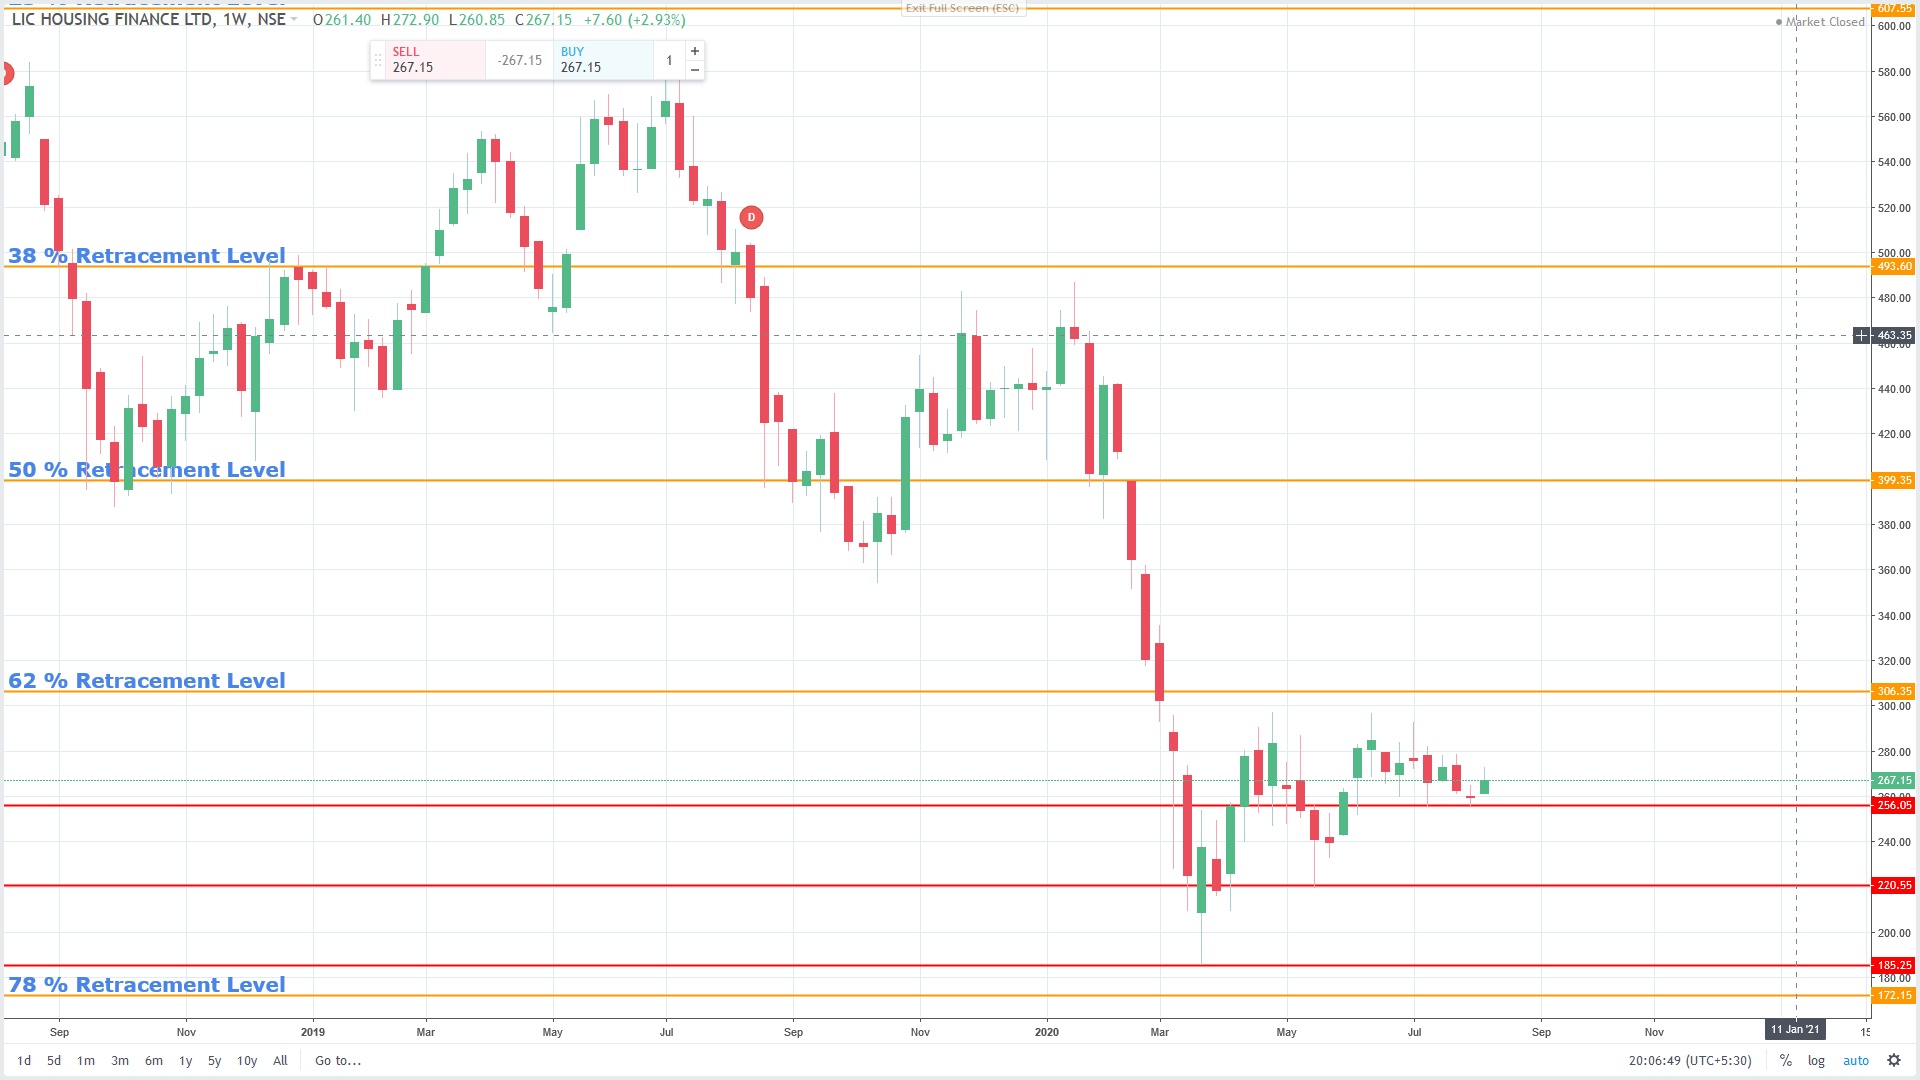
Well coming to the weekly chart we can see in the week of 23rd march 2020 it was that it was at 185.25 which has printed a higher low in comparison to monthly Time Frame after a Big Correction, so after 23rd march week it has never gone to that 185 price, then afterwards it gave us some short rally till a point of 298 as we can see and again it corrected a bit and printed a higher low with a price of 220 which is marked in red.
Then again afterwards printing a higher low of 220 if started his journey towards upwards direction and made a high of 296.40 which have not broken a previous high of 298 and again corrected a bit due to a selling pressure and now it is at a critical juncture, it seems to be printing a higher low again at a level of 256.
Currently from weekly time frame it is difficult to make out what it is doing, so again let’s move deeper into a smaller time frame and analyze it
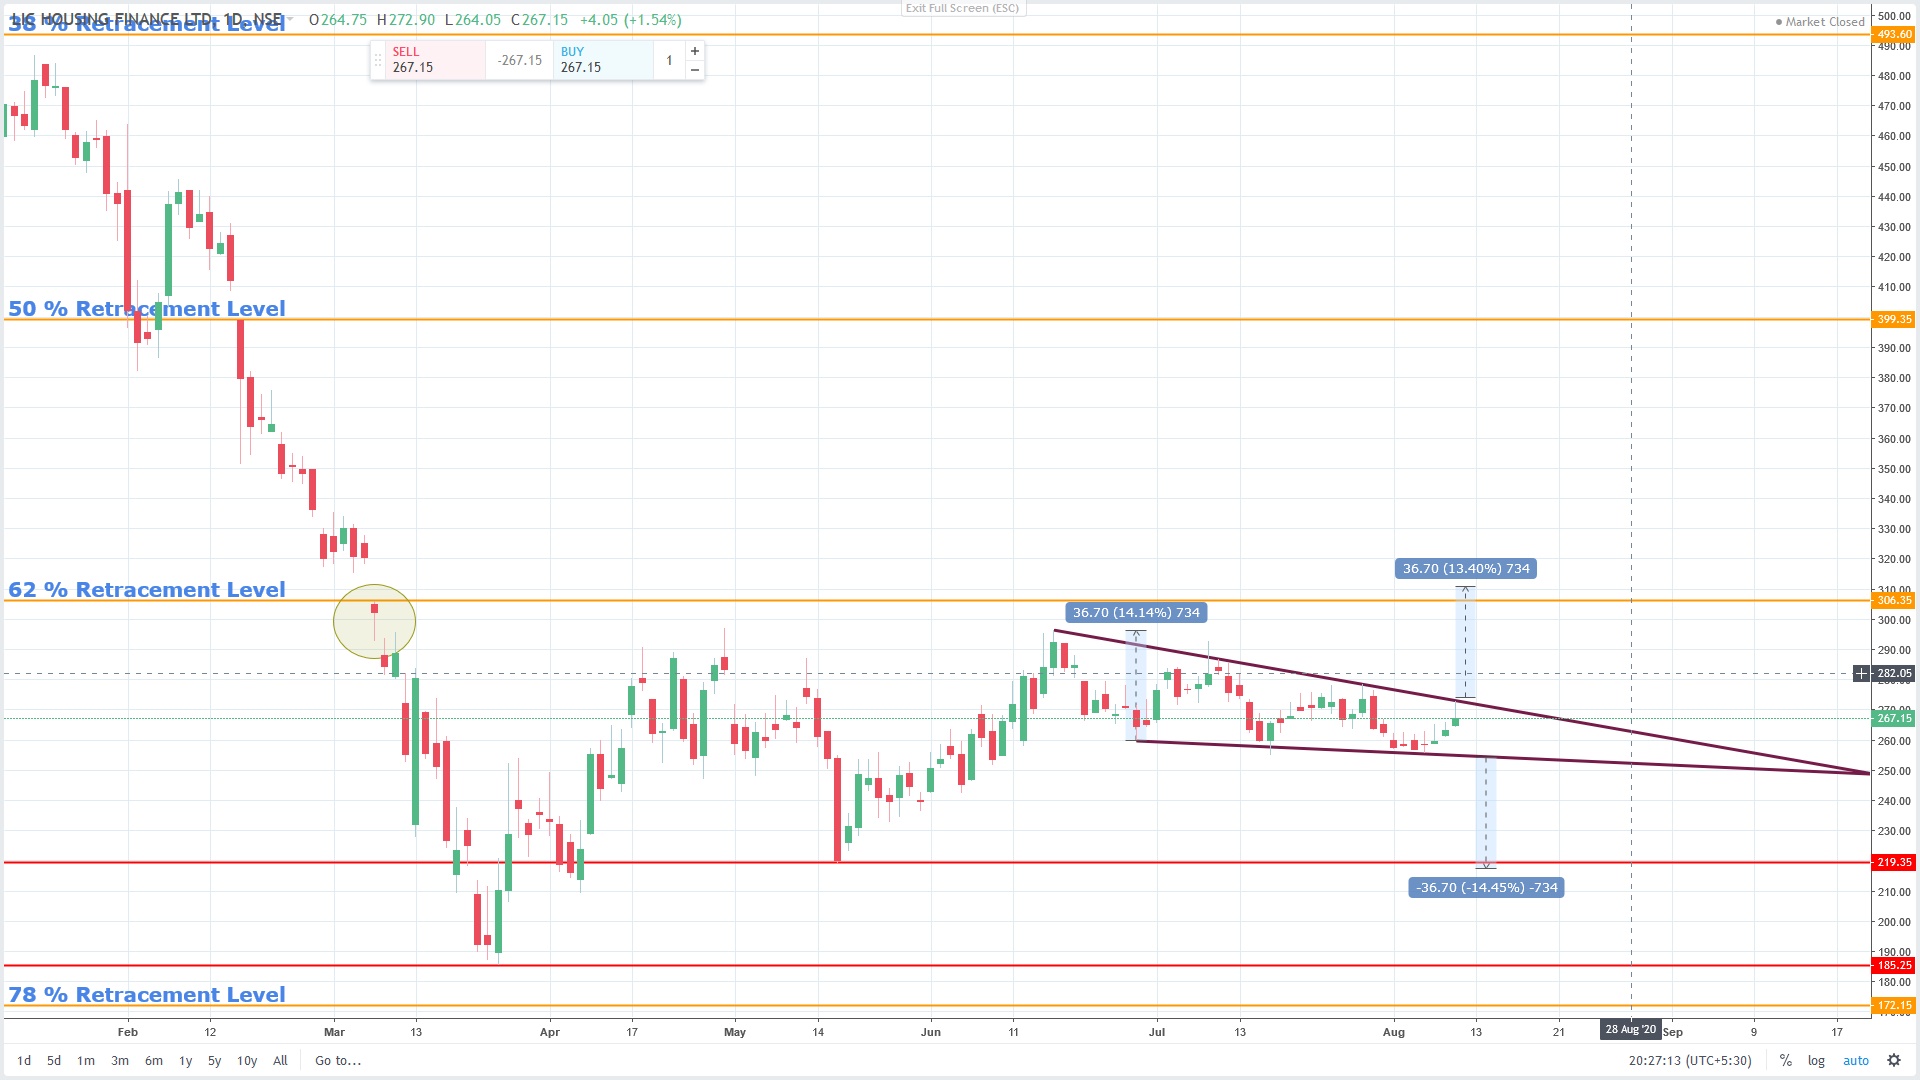
In daily time frame we can see that it is clearly printing a higher and higher low and currently in a small correction it is making tighter lower highs and lower lows which show the price currently is not able to go downwards and its restricting, which means it has the good support.
In the daily time frame you could also observe that it is in a bit sideways direction and a wedge like pattern is formed so let’s see where the price goes after a breakout or a breakdown.
Conclusion:
Point to note :
62% Level of Retracement is at 306.35
Higher Low level is at 219.3
These are the major critical levels of this stock. Either of them breaks the stock will move in that particular direction. After 306.35 we have a target of roundabout 400. Also a point to note there is a gap with the hammer at the level of 306.65.
So Anything above 306.65 is a Buy.
If you are Holding, then you might Hold it with Stop Loss of 230
This particular stock looks very interesting from an investment point for a long term so let’s see how things turn out hopefully we could generate good returns from it in the near future.
===================================================================
So that’s all for today,
If you have directly landed on this page do check out my other informative sections of blog below:
- Basics of Stock Market
- Stock Picks of the Week
- Watchlist of the Week
- Stocks
- Indices
- Currencies
- Commodities
Note:
Stop Loss should be on closing basis. For Example after Buying Whirlpool for 2140 and at end of the Day/Week/Month based on Chart Time Frame, if it is Closes Below 2091 then you can confirm that our Stop Loss has been triggered.
PLEASE FOLLOW STOP LOSS STRICTLY TO PRESERVE YOUR CAPITAL
Please read Disclaimer before Investing.
If you have liked my article then do Share, Subscribe & Follow my Blog and do leave a Comment.
Have a Great Time ahead!!
Take Care!!