
Hello Friends !!!
Welcome back to our new article after a long time, So lets begin.
Today we are going analyze one of the most awaited chart analysis, i.e Bajaj Finserv.
Major Notations:
All Time High: 1932.50
All Time Low: 9.19
3 Monthly 50 EMA: 842.35 (Strongest Resistance)
Monthly 50 EMA: 1396.32
Weekly 50 EMA: 1614.59
Daily 50 EMA: 1674.58 (Least Strongest Resistance, when compared to Weekly, Monthly and 3 Monthly)
Analysis:
To begin with lets check out how is the Dow Theory on Higher Time frame and there after moving downwards on lower time frame.
3 Monthly Chart:
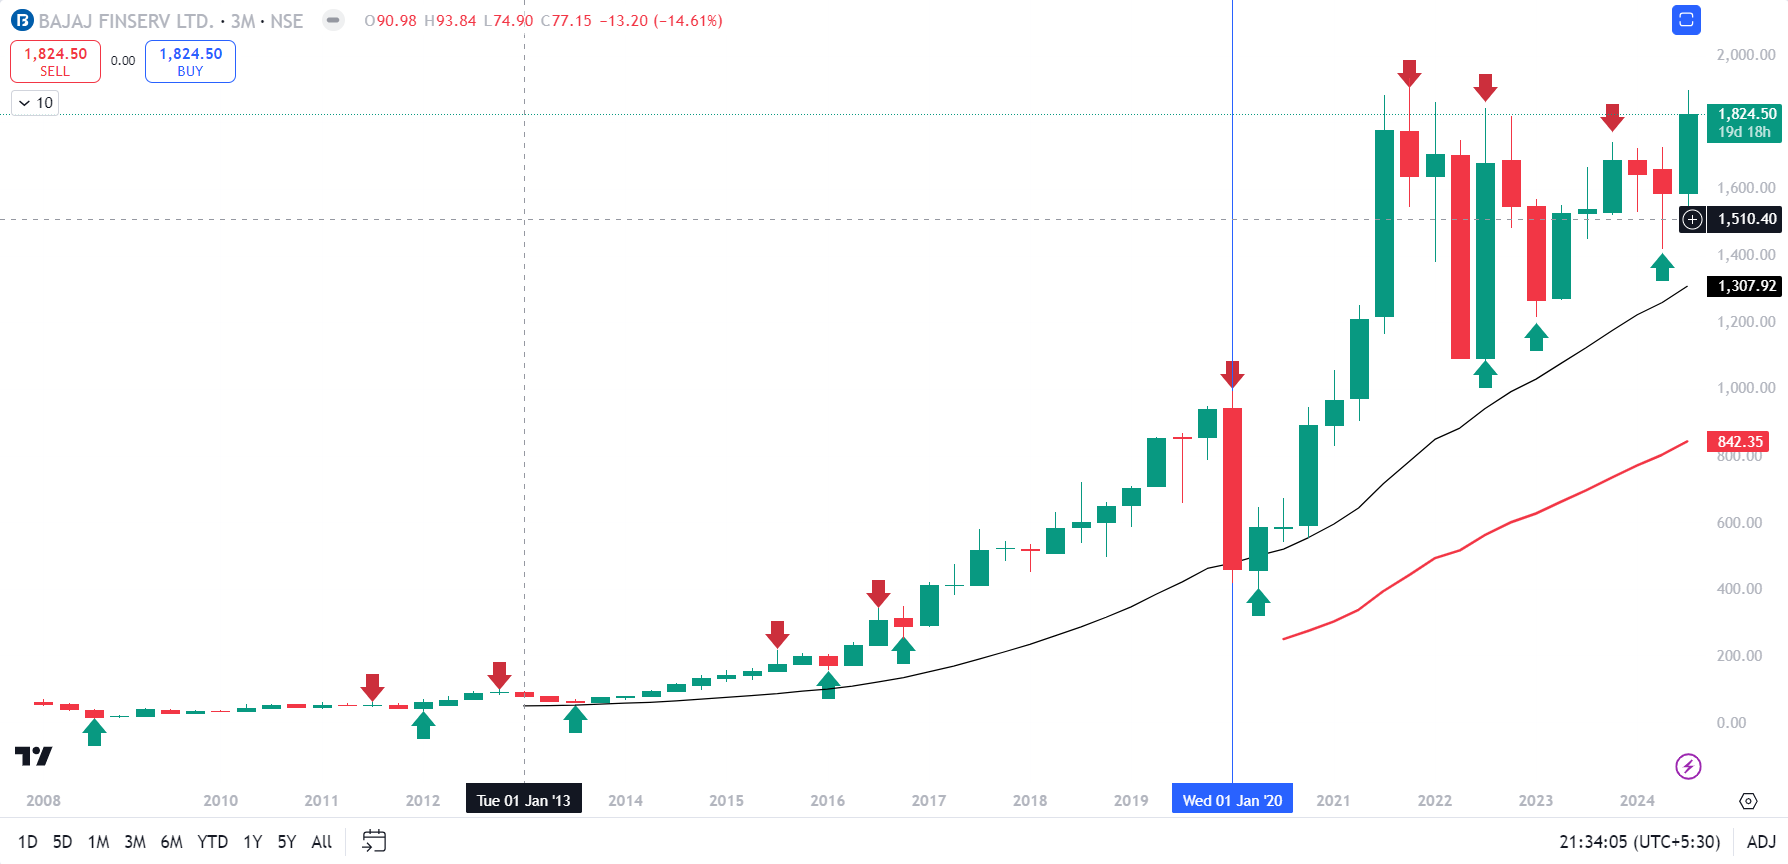
- Here you can observe for majority of time Bajaj Finserv has been in a STRONG Uptrend trend (Bullish) where from Dow Theory’s definition of uptrend of Higher Highs and Higher Lows it been clearly signified.
- Also, you can observe 01 Jan 2020 candle where it has closed below 20 SMA (Simple Moving Average of 3 Months), but next candle itself has given close above it, which signifies its bullish nature will prevail.
- After 01 Jan 2020 candle, no other candle has given close below 20 SMA of 3 Months.
Now, Lets move on to Lower time frame i.e Monthly for more observations.
Monthly Chart:
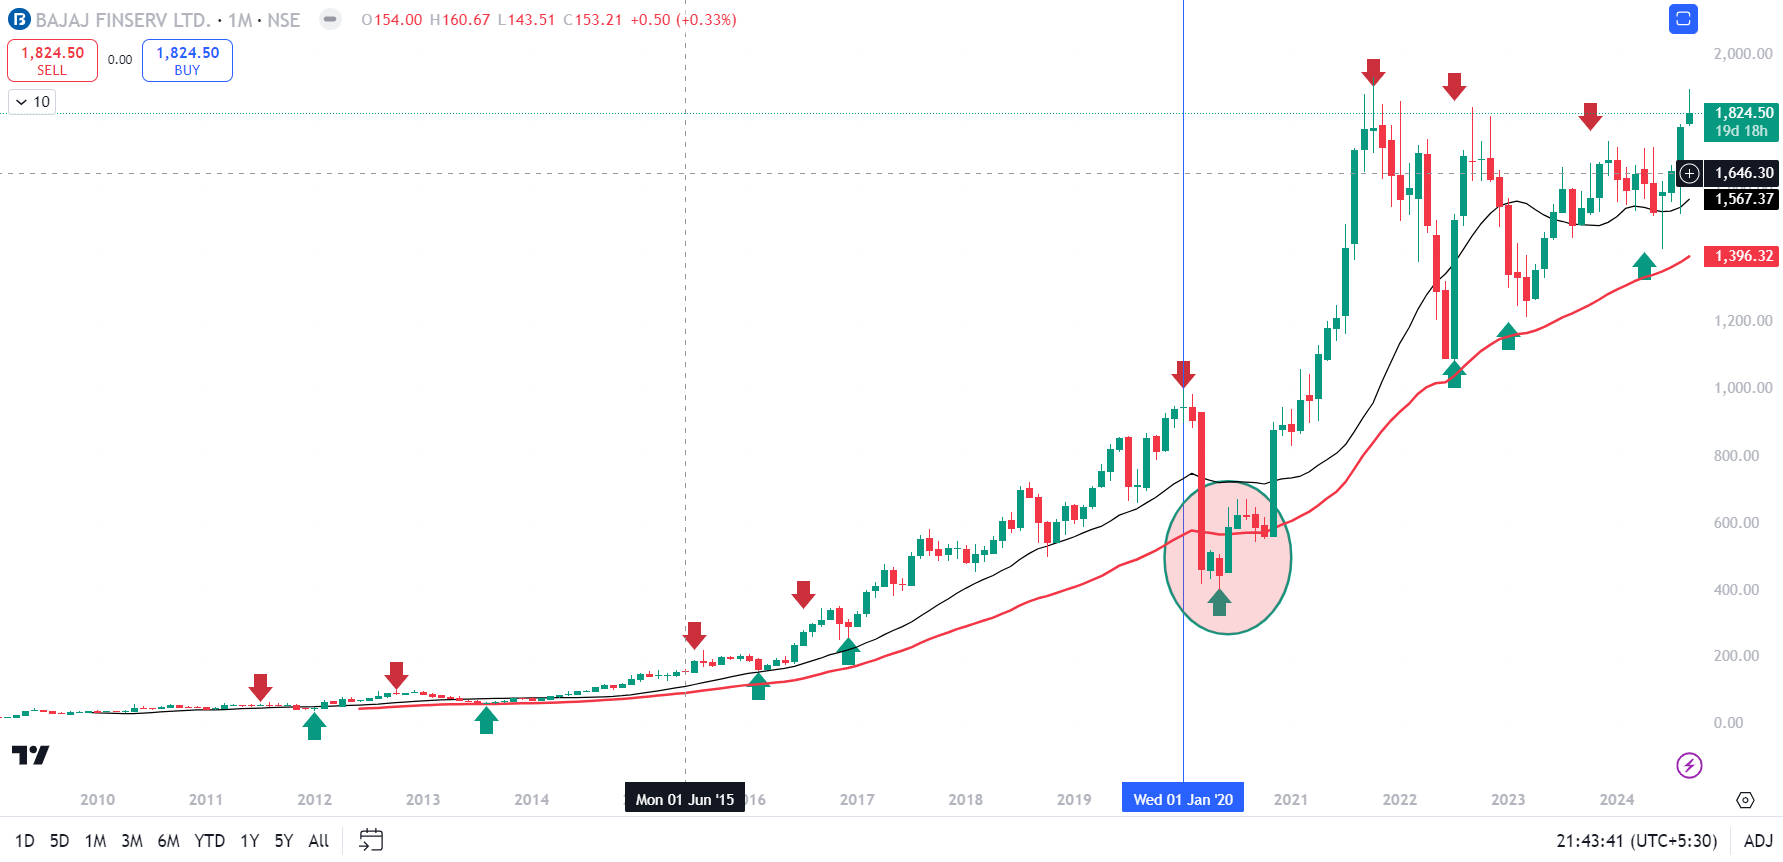
- In Monthly Time Frame you can also see that it has barely crossed 50 EMA or otherwise it has taken support on it or has done Fake Break Down.
- As you can observe, where ellipse has been marked, there price has attempted TWO times to break below 50 EMA of Monthly.
- Once it was successful though but after 2 months in 3rd Month candle broke above 50 EMA.
- At Second instance also it tried but, it was a Fake break down and Bulls took charge of the price.
- Thereafter, an uptrend was observed followed by a side ways trend.
To Study more deeply lets move on to a Weekly Time for more insights.
Weekly Chart:
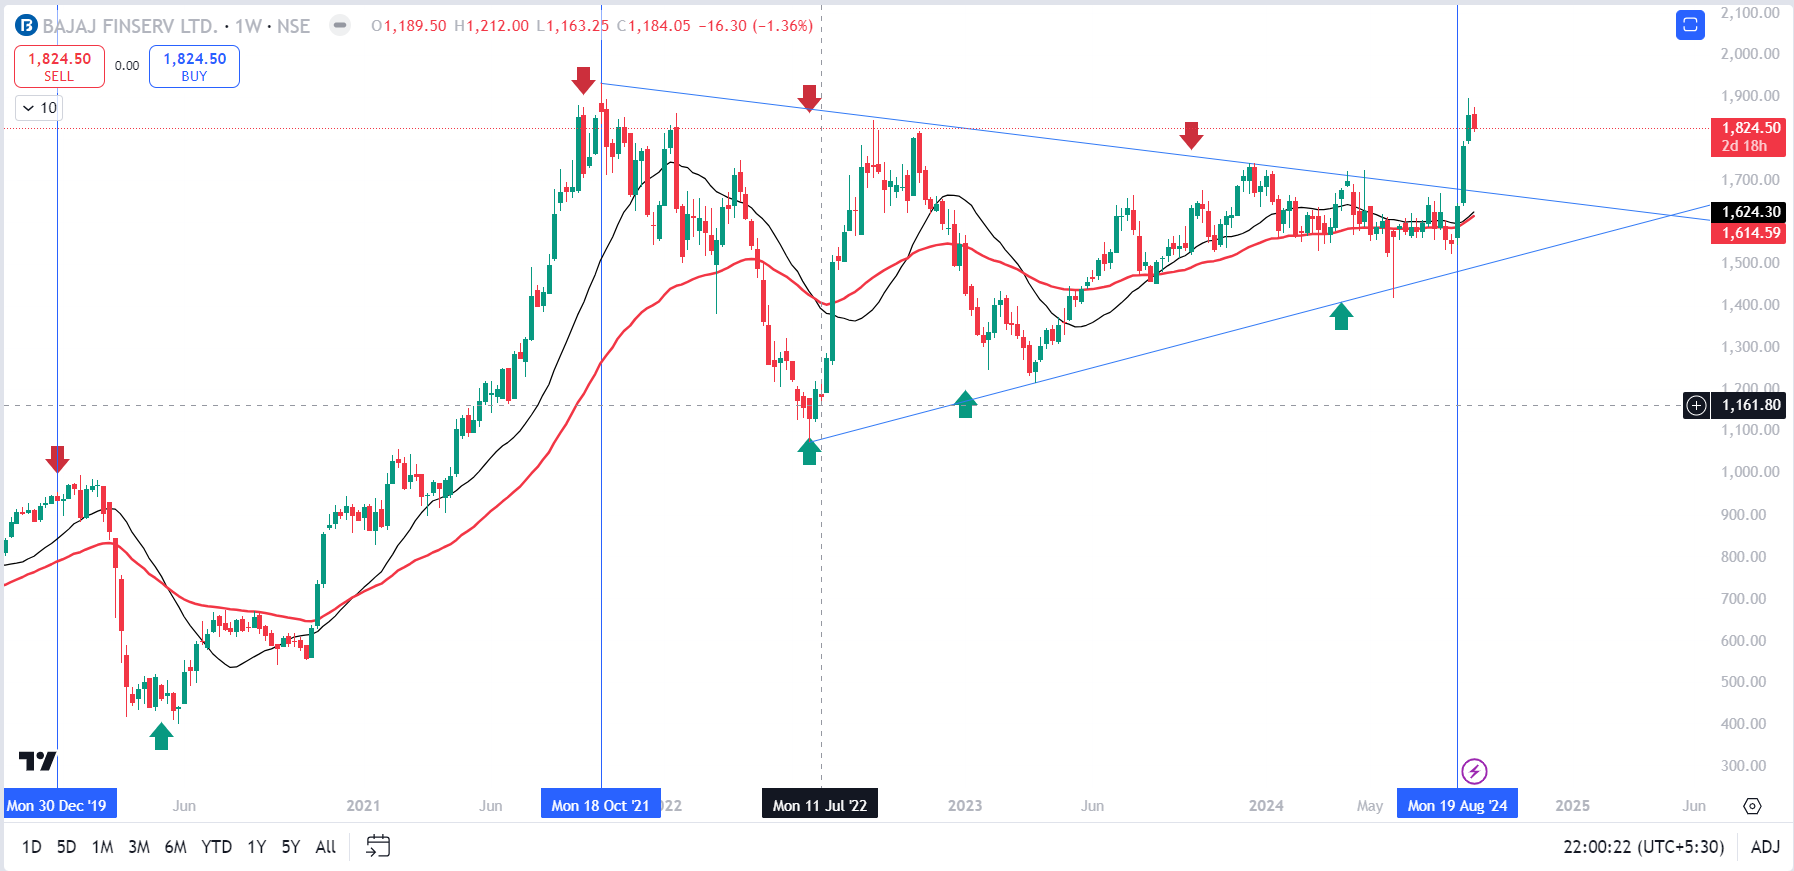
- As discussed earlier we can see that after a significant Uptrend there is Sideways trend, and this sideways trend has lasted about for almost 3 Years and right that’s 3 years.
- So, after 3 years we have a breakout after 19 Aug 2024 candle of a Side ways trend, which is also considered as a strong breakout.
- We can observe that there is also a Chart pattern of Triangle pattern and it has already been broken and price is in impulsive action.
So, Now question arises how to trade Bajaj Finserv? Is Bajaj Finserv a Buy? or Is Bajaj Finserv just doing a Fake Break Out? Lets move on to conclusion quickly and find out how to trade bajaj finserv or should we wait.
Before that we can just have a glimpse of Daily chart and find out are there any important observations or Levels which are needed before we jump on to a conclusion.
Daily Chart:
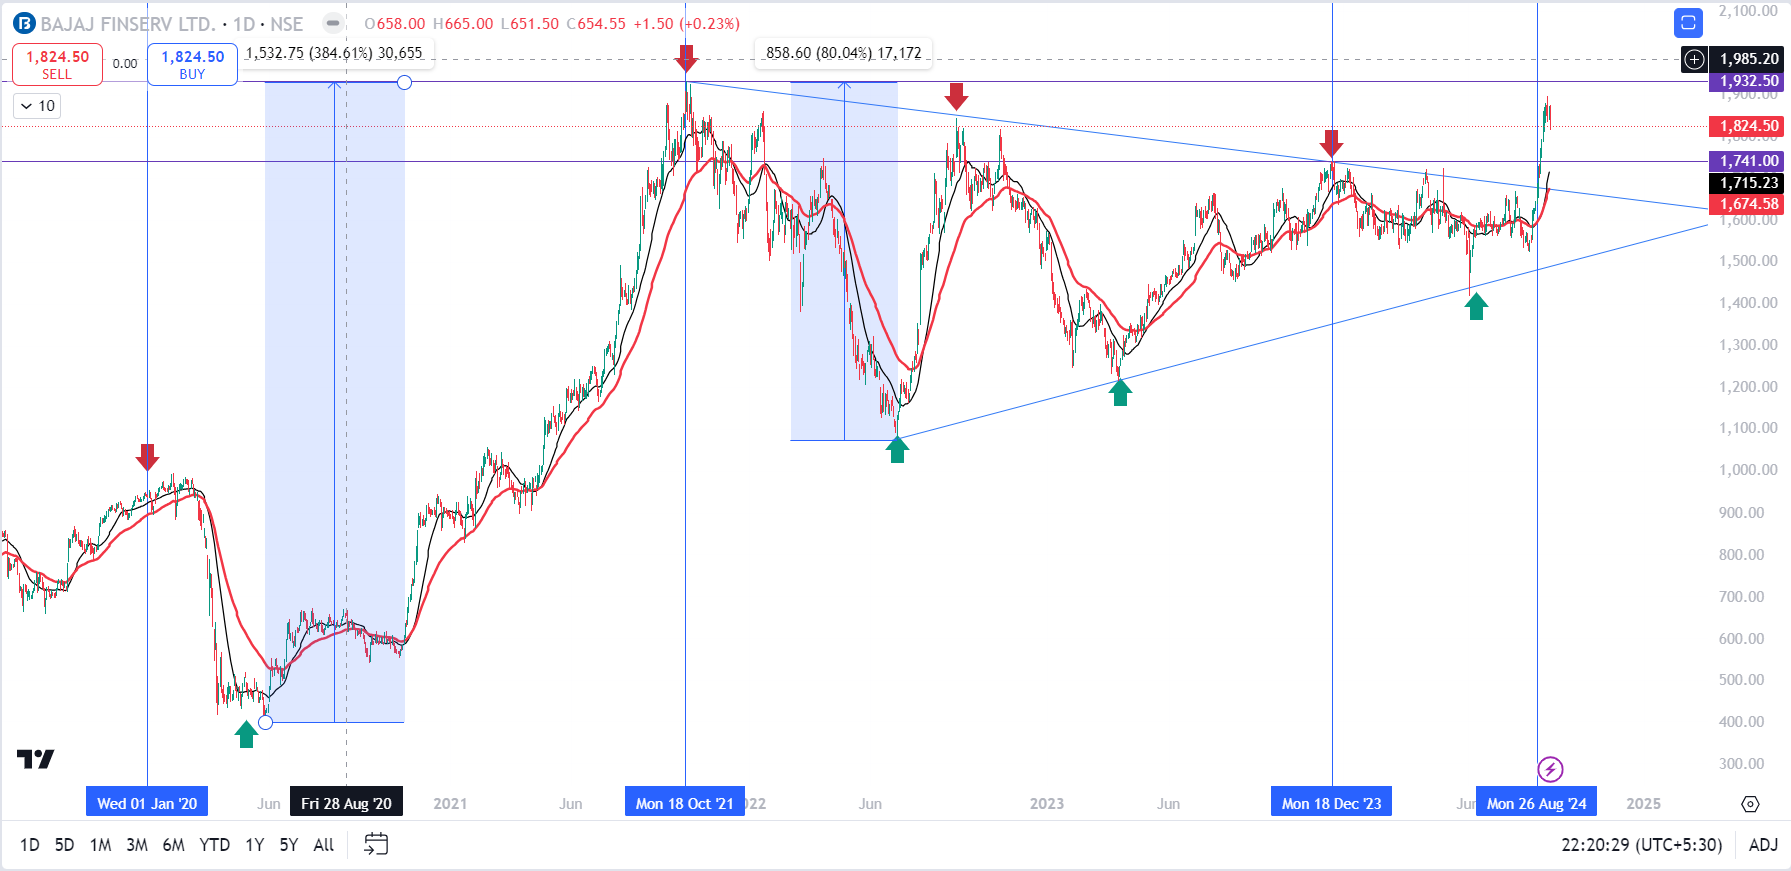
- As discussed earlier, it is a Triangle pattern and also Flag and Pole kind of a pattern can be observed, with Pole as previous uptrend and Triangle as a Flag.
-
Observations to be noted are as below;
- 26 August 2024 as a Beak Out of a Triangle / Flag point.
- 18 August 2024 a Resistance Line has been marked
- 18 Oct 2023 a All Time High resistance line has been marked
- Price range tool has been used for Pole measurement and Flag’s base measurement.
- With above observation we can confirm that break of Triangle / Flag has been confirmed and we need to look for a probable trade.
- So, Now lets jump in to conclusion and check out what are the probable target of Bajaj Finserv
Conclusion:
As we have seen very optimistic pattern of Flag and Pole and Triangle can be traded lets check out how can be do it.
First Probability:
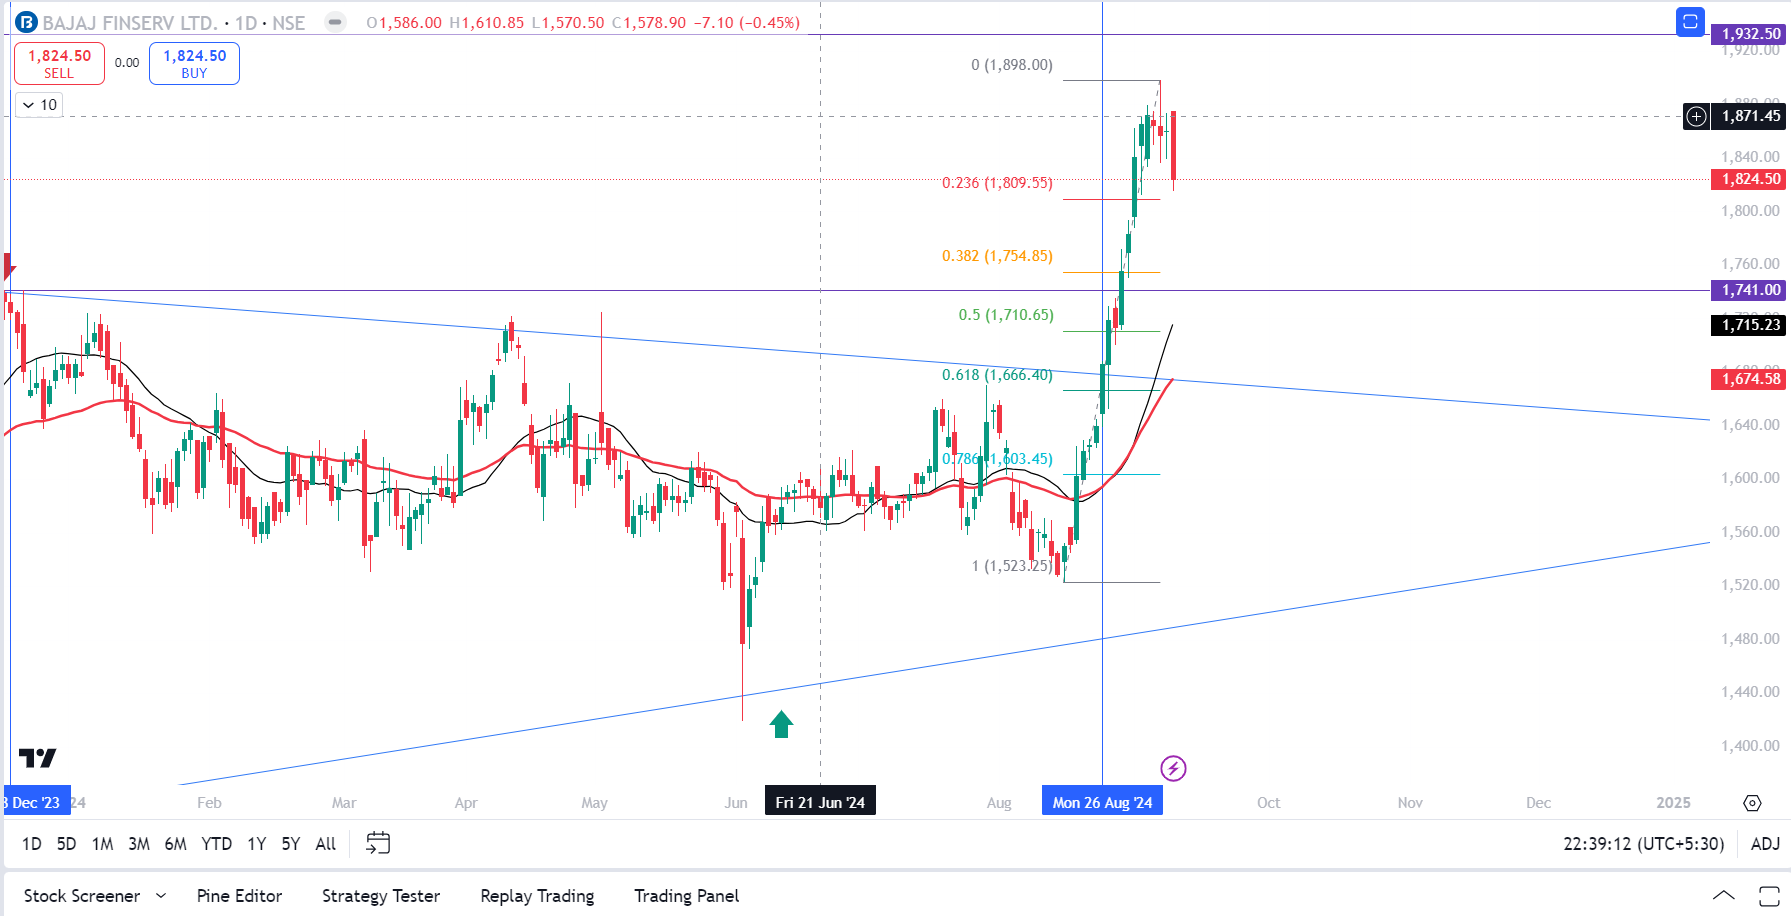
- Wait for price to retrace as it has already moved at very fast pace
- We can look for a bullish price action at a level of 50-62.5% level of retracement, also a Support of 1741 is present.
Second Probability:
- If price does not retrace and directly moves up above All time high, then we may initiate trade above ATH level which is 1932.5
Now lets check out Short Term and Long Term Targets
Short Term Targets:
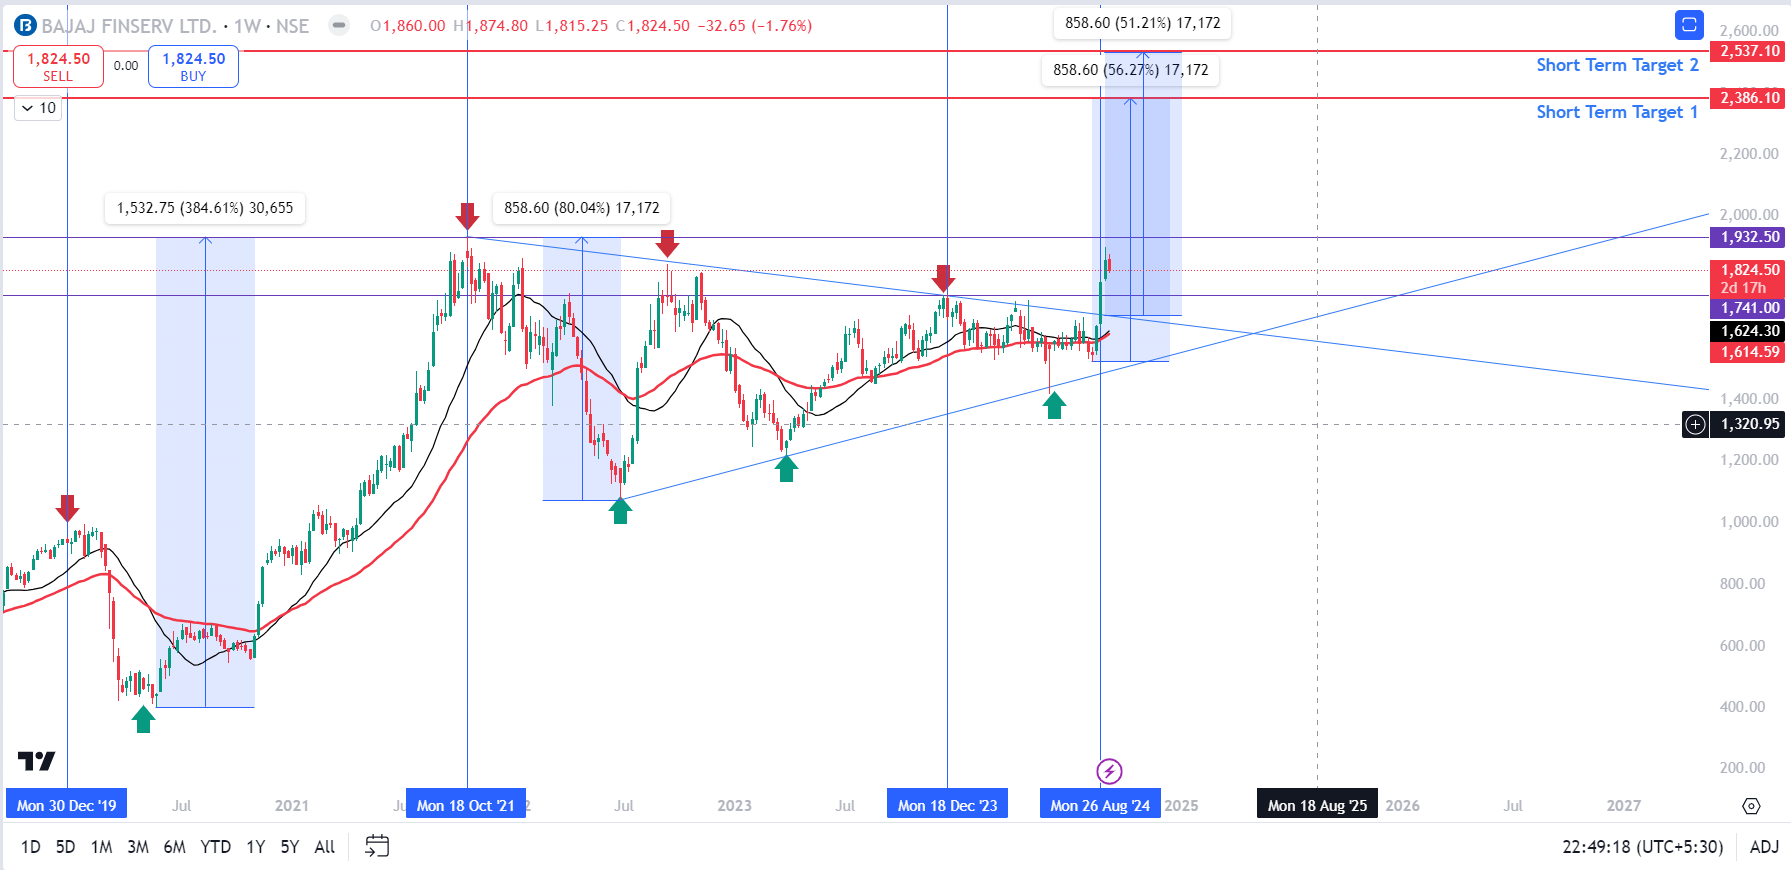
Target 1: 2386
Target 2: 2537
Long Term Target:
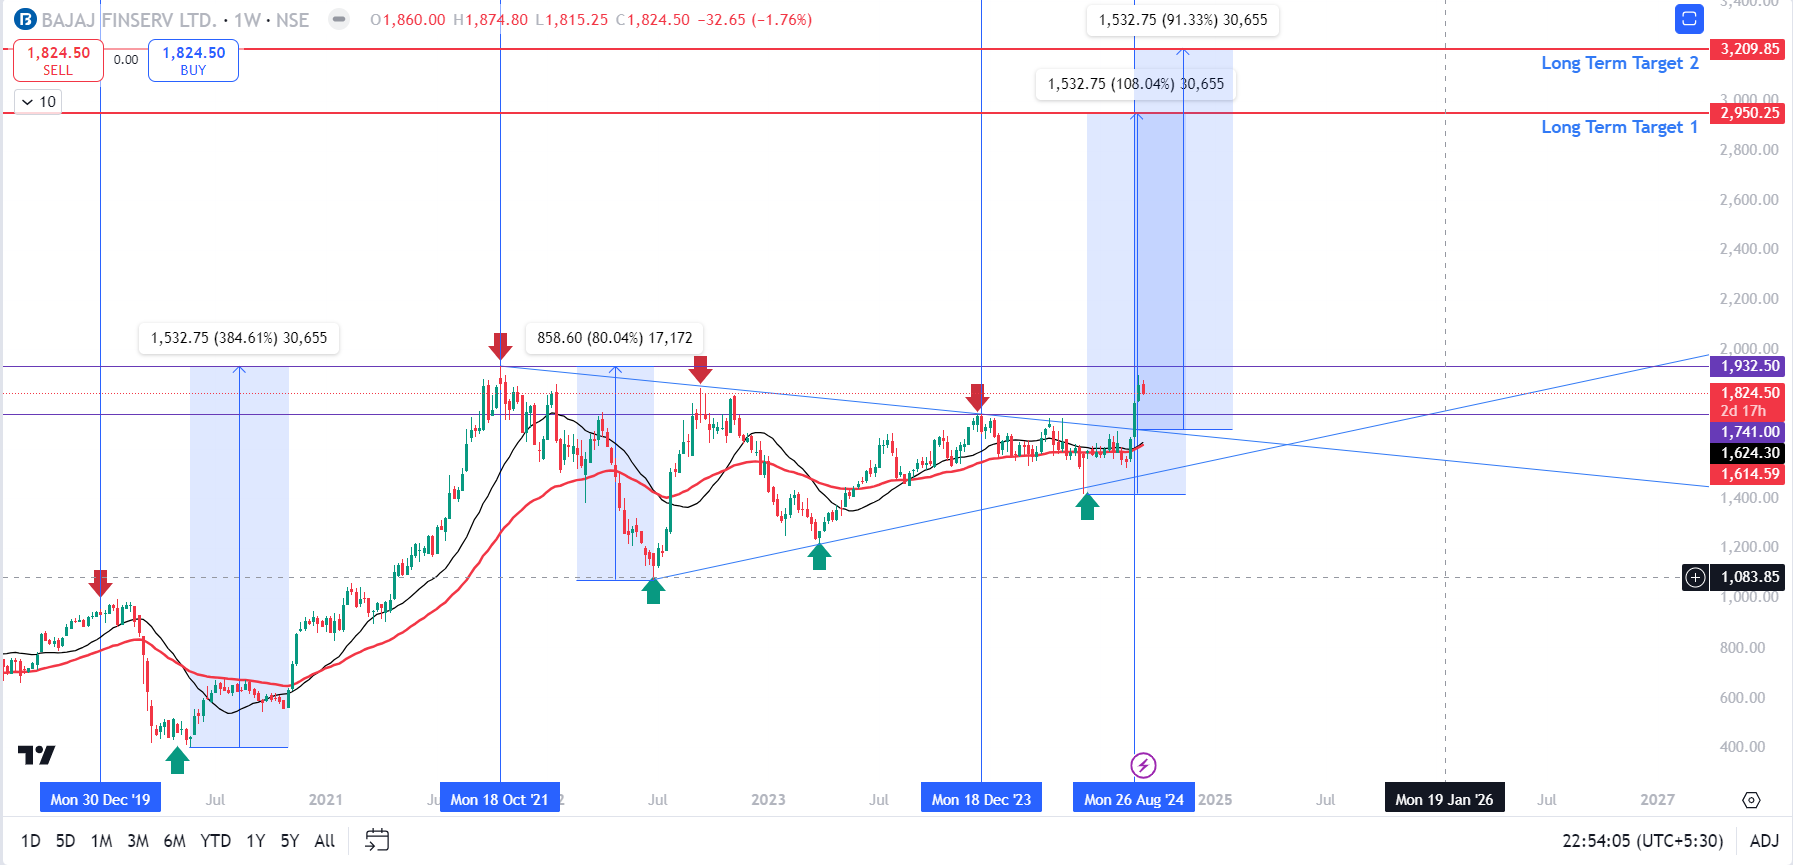
Target 1: 2950
Target 2: 3209.
So Friends that’s all for Today, I will be posting next set of picks soon,
Till Then Stay tuned!!!!!!
If you have directly landed on this page do check out my other informative sections of blog below:
- Basics of Stock Market
- Stock Picks of the Week
- Watchlist of the Week
- Stocks
- Indices
- Currencies
- Commodities
Note:
Stop Loss should be on closing basis. For Example after Buying Whirlpool for 2140 and at end of the Day/Week/Month based on Chart Time Frame, if it is Closes Below 2091 then you can confirm that our Stop Loss has been triggered.
PLEASE FOLLOW STOP LOSS STRICTLY TO PRESERVE YOUR CAPITAL
Please read Disclaimer before Investing.
If you have liked my article then do Share, Subscribe & Follow my Blog and do leave a Comment.
Have a Great Time ahead!!